
ON-TIME PERFORMANCE: figures do not reflect passenger experience

I recently reported on the on-time performance of Australian airlines as monitored by the ACCC (Australian Competition and Consumer Commission) for the year up to April 2025. I’ve since read a rather informative article on the Crikey website. The latest ACCC report on domestic aviation handed Qantas a little public relations victory. Qantas beat Virgin Australia in on-time performance (OTP) for a month. However, travellers should not take the numbers at face value. Australia’s OTP scores are as much about spin as they are about service. Let me explain.
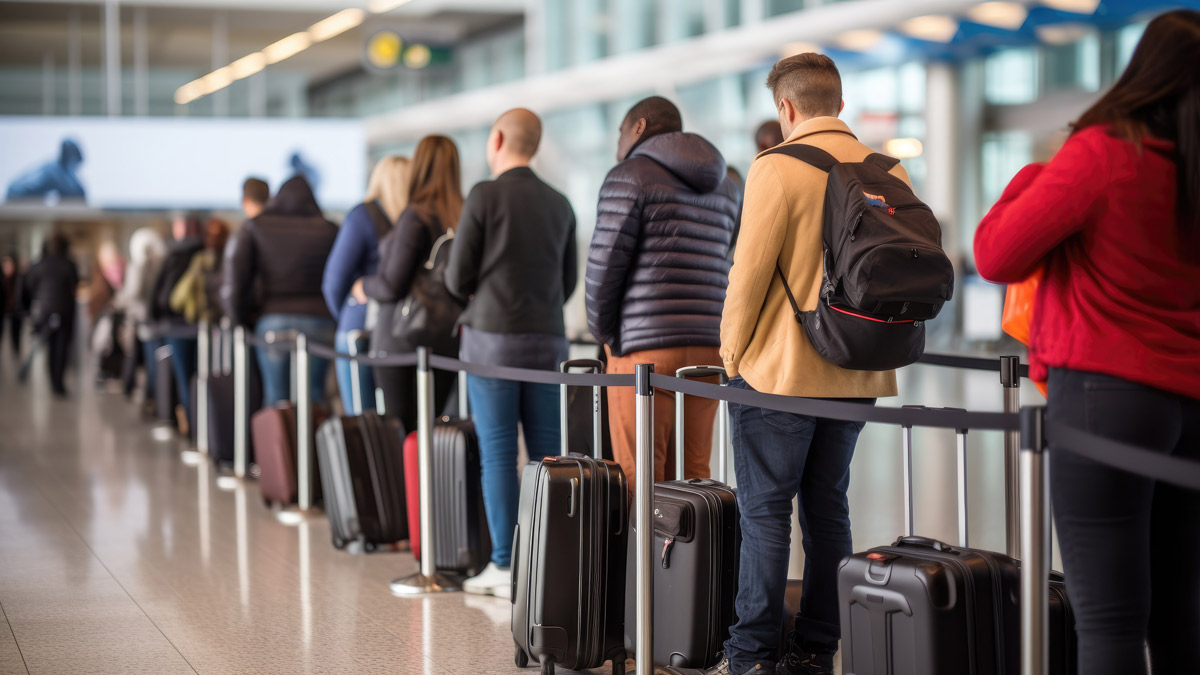
Punctuality as public relations
According to the ACCC, industry-wide on-time arrivals averaged 82.4% in April 2025, the best recorded score in three years. Cancellations were also low, averaging 2.4% in June. Virgin Australia leads in reliability, and Qantas’s rate was more than double that of its duopoly partner.
Passengers should celebrate! But will they really?. In Australia, OTP data is self-reported by the airlines. O-oh, what does that mean? To start, it excludes many monopoly routes. The statistics also don’t have any detail about why a flight was delayed or cancelled. That allows airlines, such as Qantas and Virgin, and other carriers to present a picture without detailing whether delays were within their control.
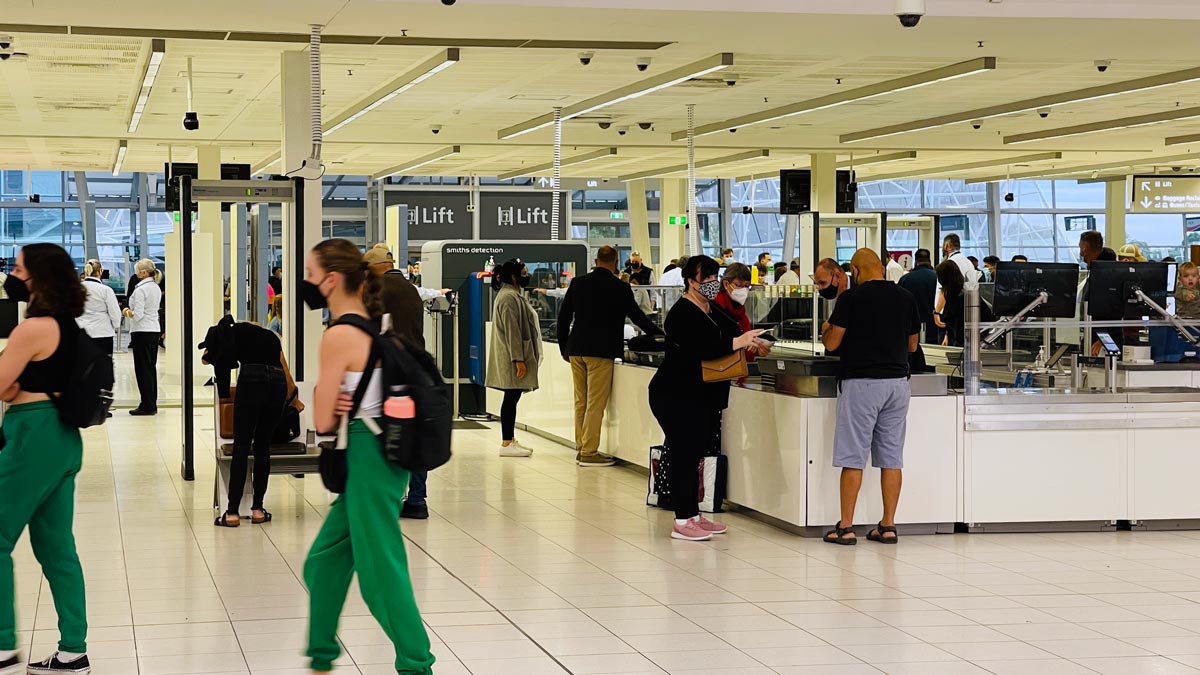
How the airlines game the system
We have some anecdotes about statistical massaging from pilots and other insiders. Let’s start off with ‘schedule padding’. This is where extra minutes are added to the publicly available schedule. This common practice means that a flight that is actually delayed appears to arrive on time. An example might be a route that actually takes two hours to complete, but is scheduled as 2.5 hours. That gives the airline a half-hour buffer against recording a late arriving or departing flight.
You can sometimes see the possibility of this when comparing scheduled flight times for the same routes, with the same aircraft but on different airlines.
The next tool for figure massaging of OTP is rescheduling. Here, the clock is effectively reset. This is useful on flights where there is no spare aircraft or crew available to cover delays.
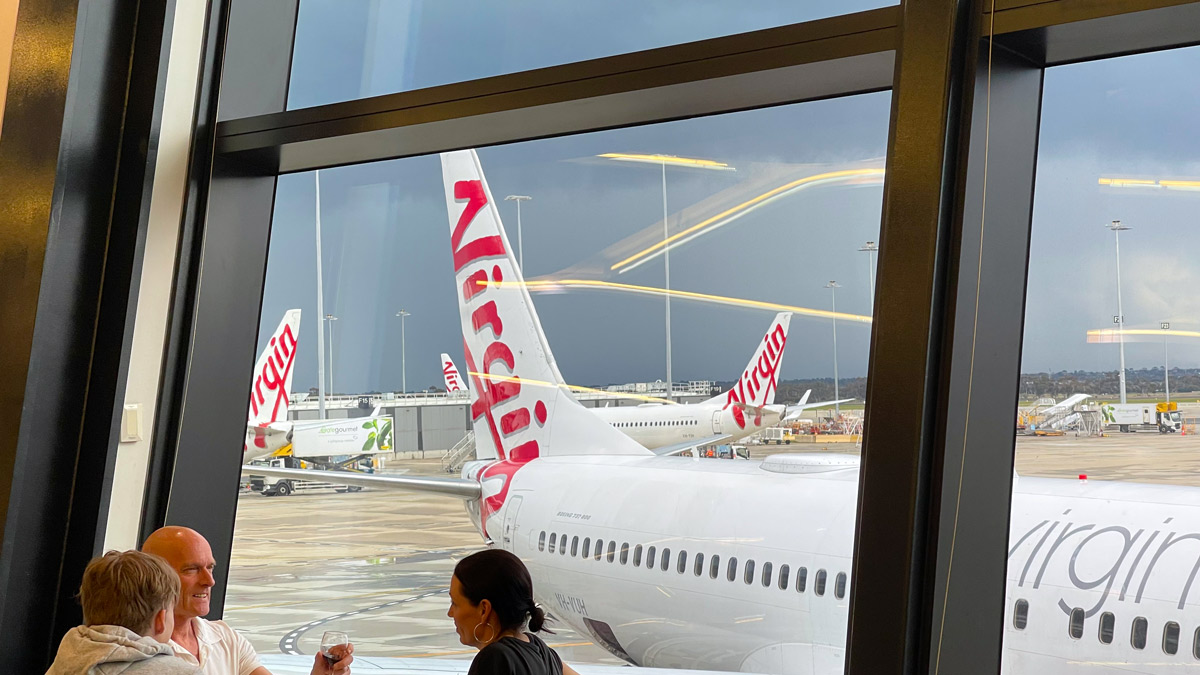
Flights can also be rescheduled to reset the clock, especially in a network where there are no spare aircraft, parts or crew to absorb delays.
Another tool is cancelling a delayed flight. That’s an easy way to improve punctuality statistics, although it doesn’t do much for your cancelled flight statistics or the airline’s reputation with passengers.
Although the ACCC keeps a fairly consistent framework for the gathering and reporting of statistics, the Public Relations teams at airlines do not. They will choose the time period for reporting that gives them the most favourable OTS they can muster. For example, Qantas might use one month’s outstanding statistics to make it look good, and Virgin might point to the average of several months’ worth of data. The airlines pick the metric that suits them best. That’s why you can get more than one airline claiming to have the ‘best’ or ‘most improved’ OTP at the same time.
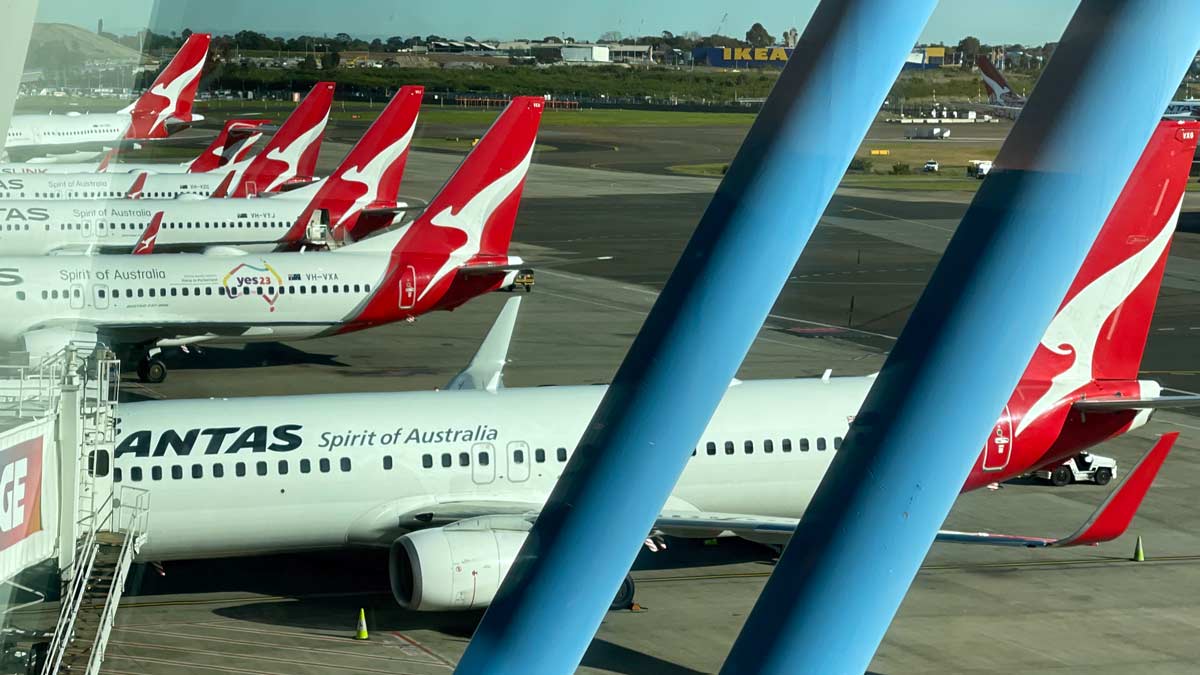
Missing routes and data
In Australia, the reporting system is managed by BITRE (Bureau of Infrastructure, Transport and Regional Economics). They only look at competitive routes with more than one airline. A further restriction is that monitored routes need to have at least 8,000 passengers per month. There are a lot of regional and remote routes that don’t meet those criteria, because they are monopolies, or use small aircraft, so don’t meet those passenger numbers. Arguably, these routes are more likely to experience more frequent delays and cancellations. But you will never find that reflected in the statistics since they are not even counted.
In the USA, the United States Department of Transportation requires airlines to publish detailed delay causes in multiple categories. It also has the power to enforce that reporting. In Europe, passengers are entitled to €600 (approximately A$1,074) in compensation for long delays and cancellations that are within the airline’s control. While providing a financial incentive for OTP, it also creates a highly contested area regarding what constitutes a delay or cancellation caused by the airline, and what does not.
In Australia, there are no such financial penalties. The 2024 white paper proposed an ombuds scheme, but did not outline a specific compensation framework. Anyhow, it’s a year down the track, with no progress on most of its recommendations.
2PAXfly Takeout
The OTP figures that airline press releases trumpet are not the best measure of the experience of delays and cancellations for passengers. Because they are self-reported, they are open to massaging. They also don’t cover all flights or provide the details that would give us a clear picture of why cancellations and delays occur. It would also be good to know which delays and cancellations are under the control of airlines, and which are caused by weather, airports or other reasons.
To obtain a more accurate picture of OTP, the government, through its regulators, should mandate detailed reporting of the causes of delays and cancellations. Statistics covering all routes flown would also help.
Finally, if airlines were required to pay compensation for delays and cancellations they caused, we might see a true improvement in these OTP statistics.






What did you say?